Journal
Strategy decisions, execution issues, bug fixes, and the data behind them. Updated when something changes.
The backtester has a realistic fills toggle that decides whether a limit order at the ORB boundary would have filled on the signal bar. It checks one thing: did the bar's low retrace within 0.5 points of the boundary? If yes, fill. If no, skip.
That's a step function on a single variable. Retracement depth crosses 0.5 points and the fill probability jumps from 0 to 1. In practice, fill probability is probably smooth, not binary. A bar that retraces to 0.6 points away is more likely to fill than one that retraces to 3 points away, but the current model treats them the same. Both are skips.
The model also ignores everything else. Bar range, breakout velocity, time of day, volume. Any of those could influence whether a resting limit gets touched. The 0.5 point cushion was chosen because it matched the limit order offset the live bots use, not because it was fit to any data.
The first version of the model turned out to be useless almost immediately. The step function checks if the 5-minute bar's low retraced within 0.5 points of the ORB boundary. On NQ, bars move 30-100+ points. The low almost always comes within 0.5 points. The step function predicted fill for every single live signal. But 23 out of 64 actually skipped. A 36% miss rate on a model that says everything fills.
The problem is that 5-minute bars are too coarse. The bar's low might show a number below the limit price, but that doesn't mean price actually traded there during the window when the limit order was resting. The sequence within the bar matters and we can't see it.
So I fit a logistic regression on the live data instead. Across all three bots (MES, MNQ, M2K) there are 64 labeled signals from June 24 to July 24. The best single predictor turned out to be breakout velocity: how far the bar's close moved past the ORB boundary as a fraction of the bar's range. Higher velocity means price moved through the boundary fast and kept going without looking back. The logistic on velocity alone gets 75% accuracy. Adding bar range as a second feature bumps it to 77%.
Applying the fitted model to 14 years of NQ signals, the predicted historical fill rate is 62.7%. The backtester was assuming 100%. That changes the math. The raw backtest projects $36/day per contract. Adjusted for the predicted fill rate that drops to about $23/day. Live is running at $26/day. So live is actually outperforming the adjusted backtest, not underperforming the raw one. The gap I thought existed between backtest and live may not be there.
That doesn't make the model pointless though. The 62.7% is a blanket average. The real question is whether the signals that skip are the same ones that would have been profitable. If high-velocity breakouts skip more often and those tend to be winners, then skips are costing real edge. If skips are distributed randomly across winners and losers, the fill rate is just a scaling factor and the strategy's shape is fine. The model needs more data to answer that.
I added a skip percentage slider to the backtester so anyone can stress test different fill assumptions. And there's a fill model page that shows the logistic fit updating as new trades come in. The visualization plots every live signal by velocity, colored by fill or skip, with the regression curve overlaid. As the dataset grows, the curve will tighten up and we'll see whether velocity is really the whole story or if bar range and other features add something.
The model regenerates daily after market close.
Shut down the MES and M2K bots today. Running three MNQ contracts starting Monday.
The numbers forced my hand. Since June 24 when the current config stabilized: the MES bot made -$89 across 24 trades. 50% win rate on a strategy that needs 55% to break even because the stop ($60) is bigger than the target ($50). The MNQ bot made +$592 with 55% win rate and a positive expected value of $30 per trade. M2K made +$79 but on fewer trades.
I kept running all three because I assumed spreading across correlated futures gave some diversification. It doesn't. They moved the same direction 44% of days, and when they diverged, MES and M2K were just diluting MNQ's returns. Same direction days all three won or lost together. Different direction days meant MES and M2K were dragging down a good MNQ trade.
If I had been running three MNQ contracts from the start, the strategy would have returned +$1,774 instead of +$581. Same margin, same number of contracts, actually less worst-case risk ($300 vs $320 because MNQ's stop is $50 vs MES's $60).
The backtest tells a similar story. MNQ realistic is about $9,100/yr per contract. Three contracts puts that at roughly $27,000/yr. The combined backtest with all three products was $13,600/yr. Double the return for the same capital deployed.
Annualizing the live data (23 trading days, small sample): one MNQ contract projects to about $6,500/yr. Three contracts puts it around $19,400/yr before commissions of about $1,500.
The live results are tracking the backtest reasonably well. MNQ returned $592 over 23 trading days. The backtest with realistic fills projects about $833 over the same period. That's 71% of theoretical, and some of the gap is from operational issues (API hangs, token expiry) that caused the bot to skip days it would have otherwise traded. The edge the backtest found over 14 years of walk-forward validation is showing up in real fills on a real account.
I started this whole thing with a small account and no business being in futures markets. But micros let you trade real contracts for pocket change margin, and the 5-min ORB edge holds up in walk-forward and Monte Carlo. The strategy works. The only question was which product to concentrate on, and MNQ answered that pretty clearly.
Changes made: config now has CONTRACTS=3. All order placement, P&L calculation, stop loss orders, and position closes multiply by the contract count. Daily summary reports MNQ only. The old bots are stopped and disabled at the service level so they can't accidentally restart.
Commission math for planning ahead: three micro contracts cost about $6.84 round trip. Once I'm scaling to ten micros, switching to one full-size NQ contract saves roughly $4,000/yr in fees. Full-size intraday margin on Tradovate is around $500, not the $17,600 exchange overnight margin. That switch is more accessible than I originally thought.
Had a -$91 week. The backtest said the same period should have been roughly flat. That's a big gap, so I dug into the individual trades to figure out where the mismatch was.
The backtest with realistic fills showed almost every trade last week as a skip. But live, those trades filled. The backtest was skipping trades that actually happened. When I looked at why, the ORB boundaries were different.
The live bots were tracking quotes every 2 seconds during the 9:30-9:35 window and using the high and low of those ticks as the range. The backtest uses the 5-minute bar from Schwab's historical data. Those two things produce slightly different highs and lows. Schwab's bar consistently showed a wider range, which pushed the entry levels further out, which made the skip model think the limit orders wouldn't have filled.
The difference looks small. Maybe half a point on ES, a few points on NQ. But it's enough to change whether a limit at the boundary fills or doesn't, and that changes whether the trade happens at all.
All three bots now use the same Schwab historical bar that the backtest uses. At 9:35 they fetch the completed 5-minute bar from Schwab's API instead of using the tick-tracked range. If the fetch fails they retry every 30 seconds up to 5 times. If all 5 fail, they skip the day. No fallback to live ticks.
The live tick tracking during 9:30-9:35 is removed entirely. The bots just sleep during that window now. One data source for everything. The boundaries they trade on are the same boundaries the backtest evaluates.
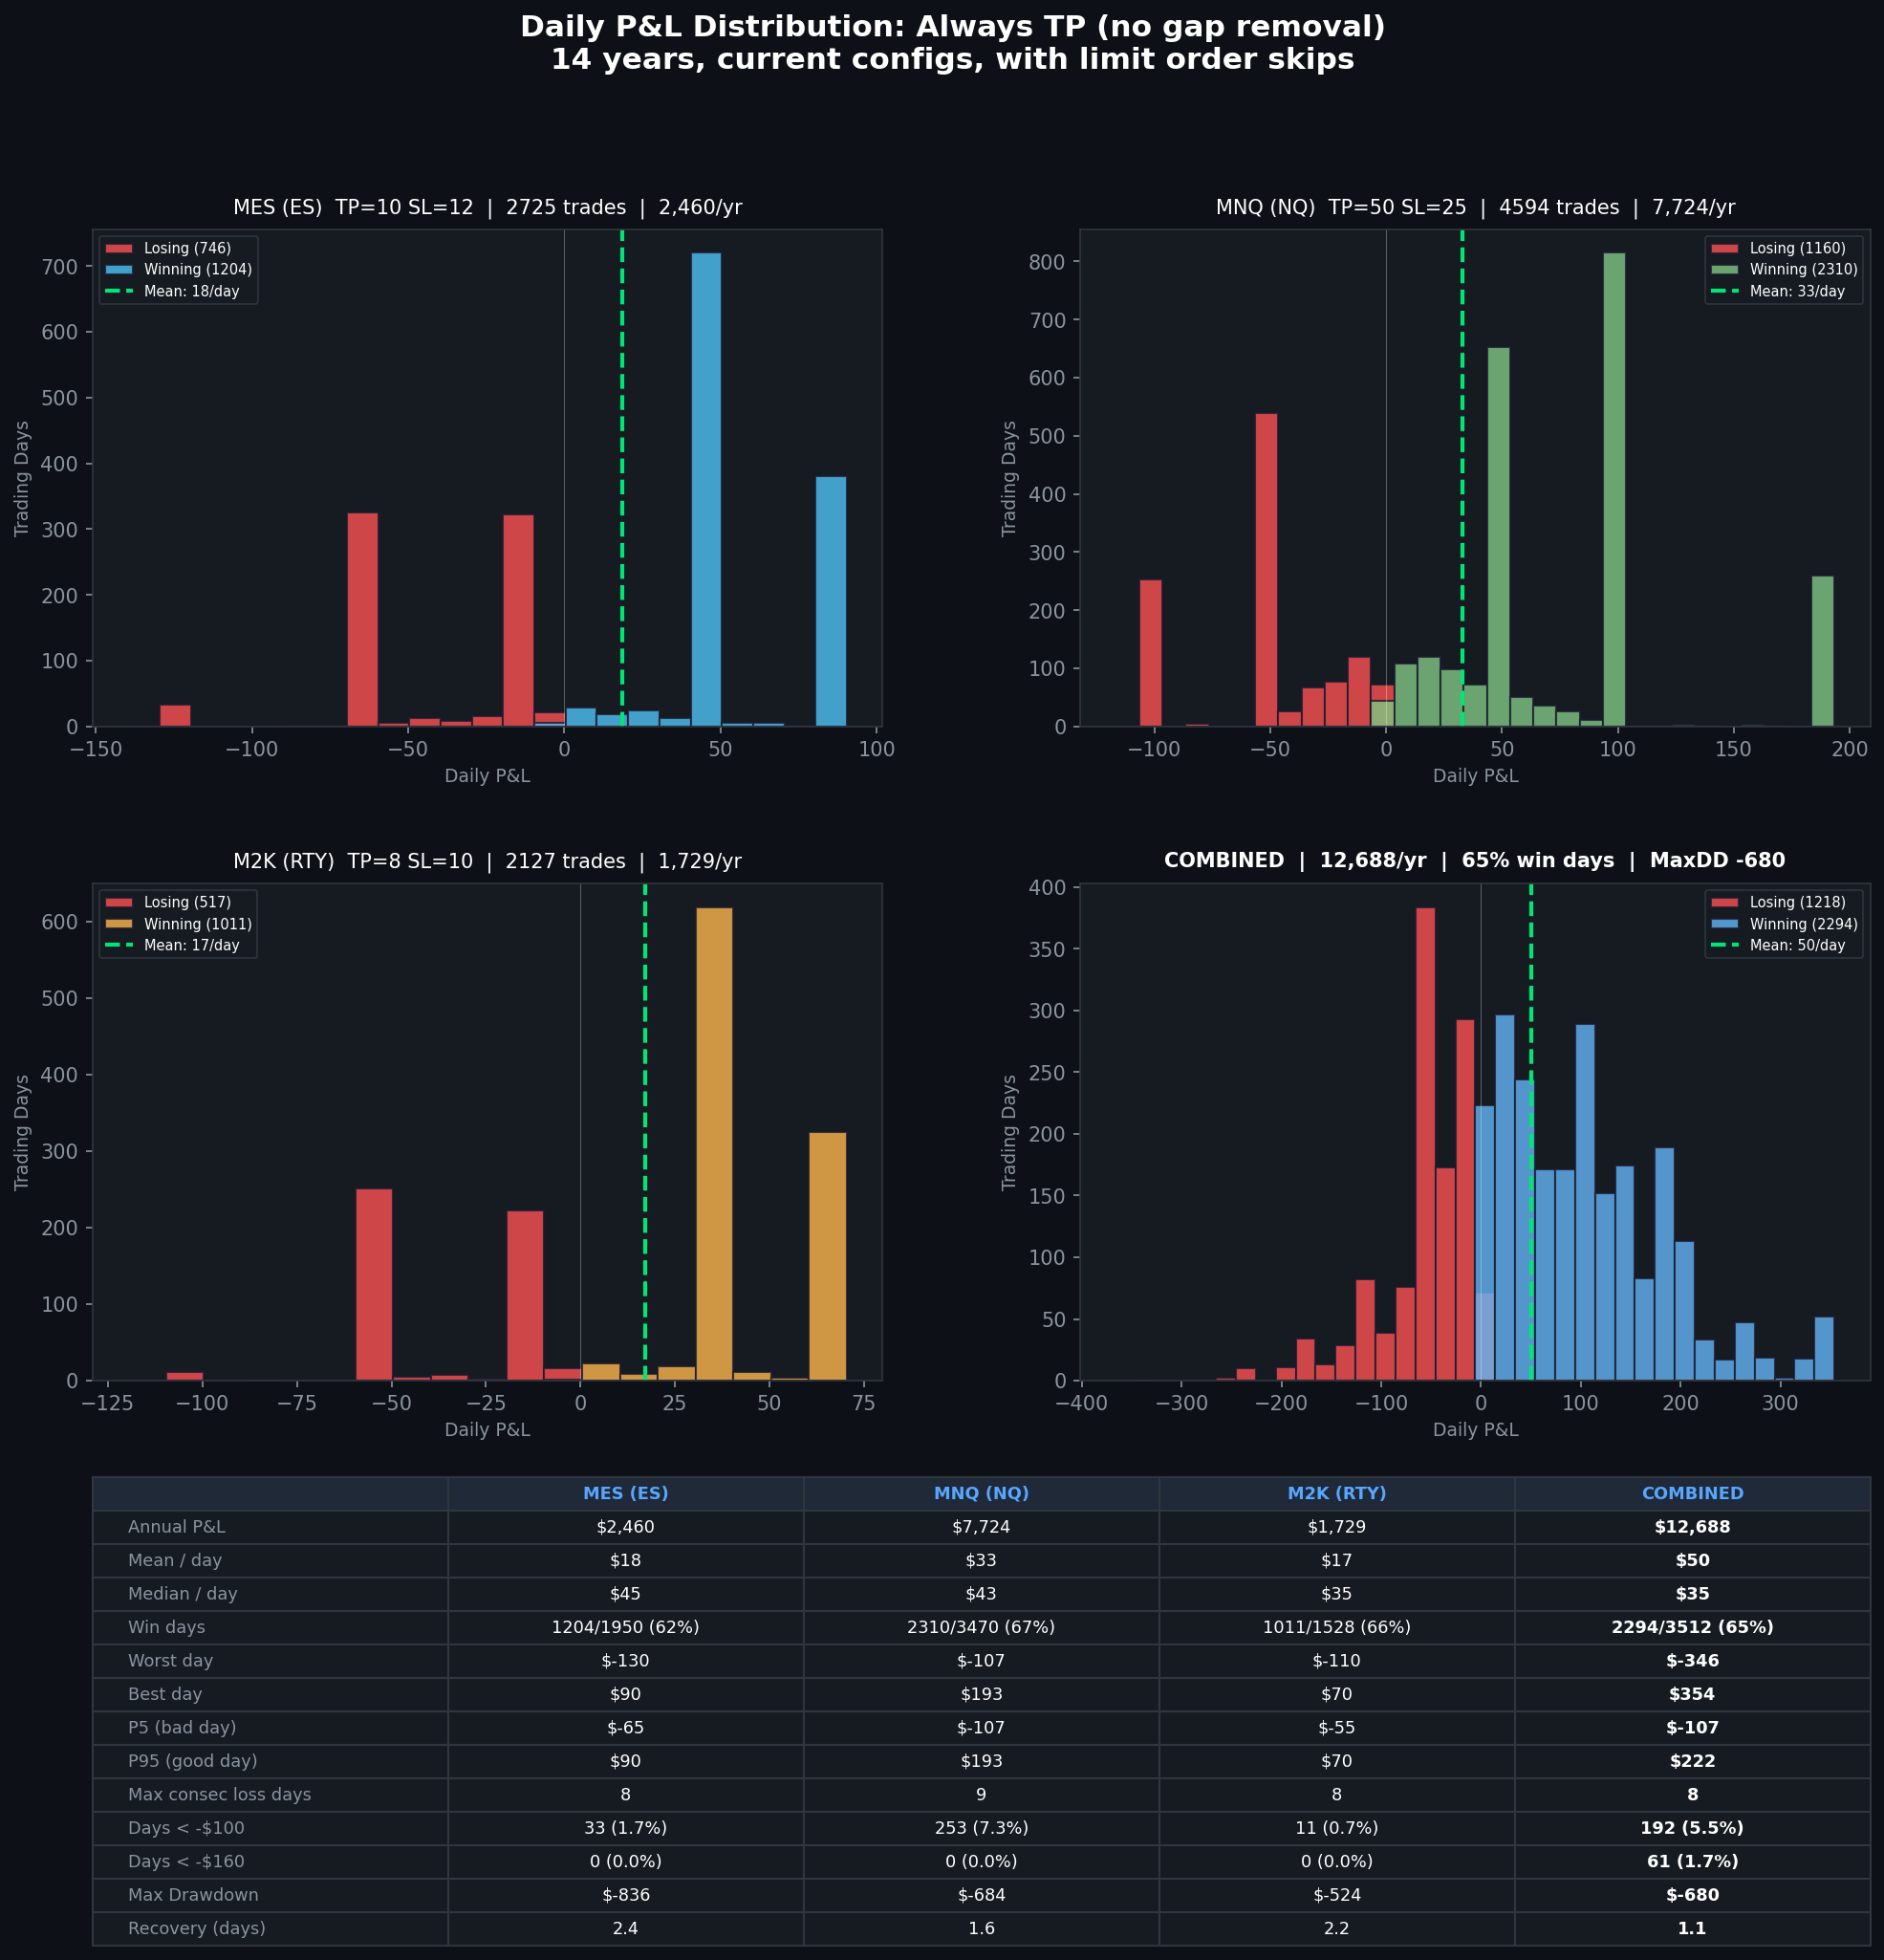
Yesterday I turned gap TP removal off after a -$160 day. All three bots hit SL on longs. My first reaction was to make the drawdowns smaller.
Then I ran the numbers on both configurations side by side and found something I hadn't thought about.
With gap removal: $14,540/yr combined, max drawdown -$1,147, 59% win days. Without: $12,688/yr, max drawdown -$680, 65% win days. The gap removal makes more money but the drawdowns scale with it. The return-per-dollar-of-drawdown ratio is actually worse with gap removal. 12.7x vs 18.7x without.
That ratio matters because it answers a question I should have been asking from the start. If the drawdowns scale proportionally with the profit, why wouldn't I just take the smoother version and add contracts when the account grows? Two contracts on the always-TP config makes $25,376/yr with a max drawdown of $1,360. That's more money than one contract with gap removal, and the drawdown is only slightly worse.
The scaling math works out to adding one NQ contract for every $640 the account grows (margin plus proportional max DD). NQ scales first because it has the best return per dollar of risk. At $2,000 I add a second NQ. At $2,600 a third. ES and RTY stay at one contract for a while.
The days worse than -$160 drop from 4% to 1.7%. The win rate goes from 59% to 65%. The best day drops from $2,660 to $354, which means no more monster gap rides, but also no more giving those gains back two days later.
I'm not turning gap removal back on. The plan is to scale contracts instead. The math is cleaner and the ride is smoother. The account needs to survive long enough for the edge to compound, and a tighter distribution does that better than chasing the big days.
Daily P&L distribution with always-TP config. 65% win days, max DD -$680, $12,688/yr combined.
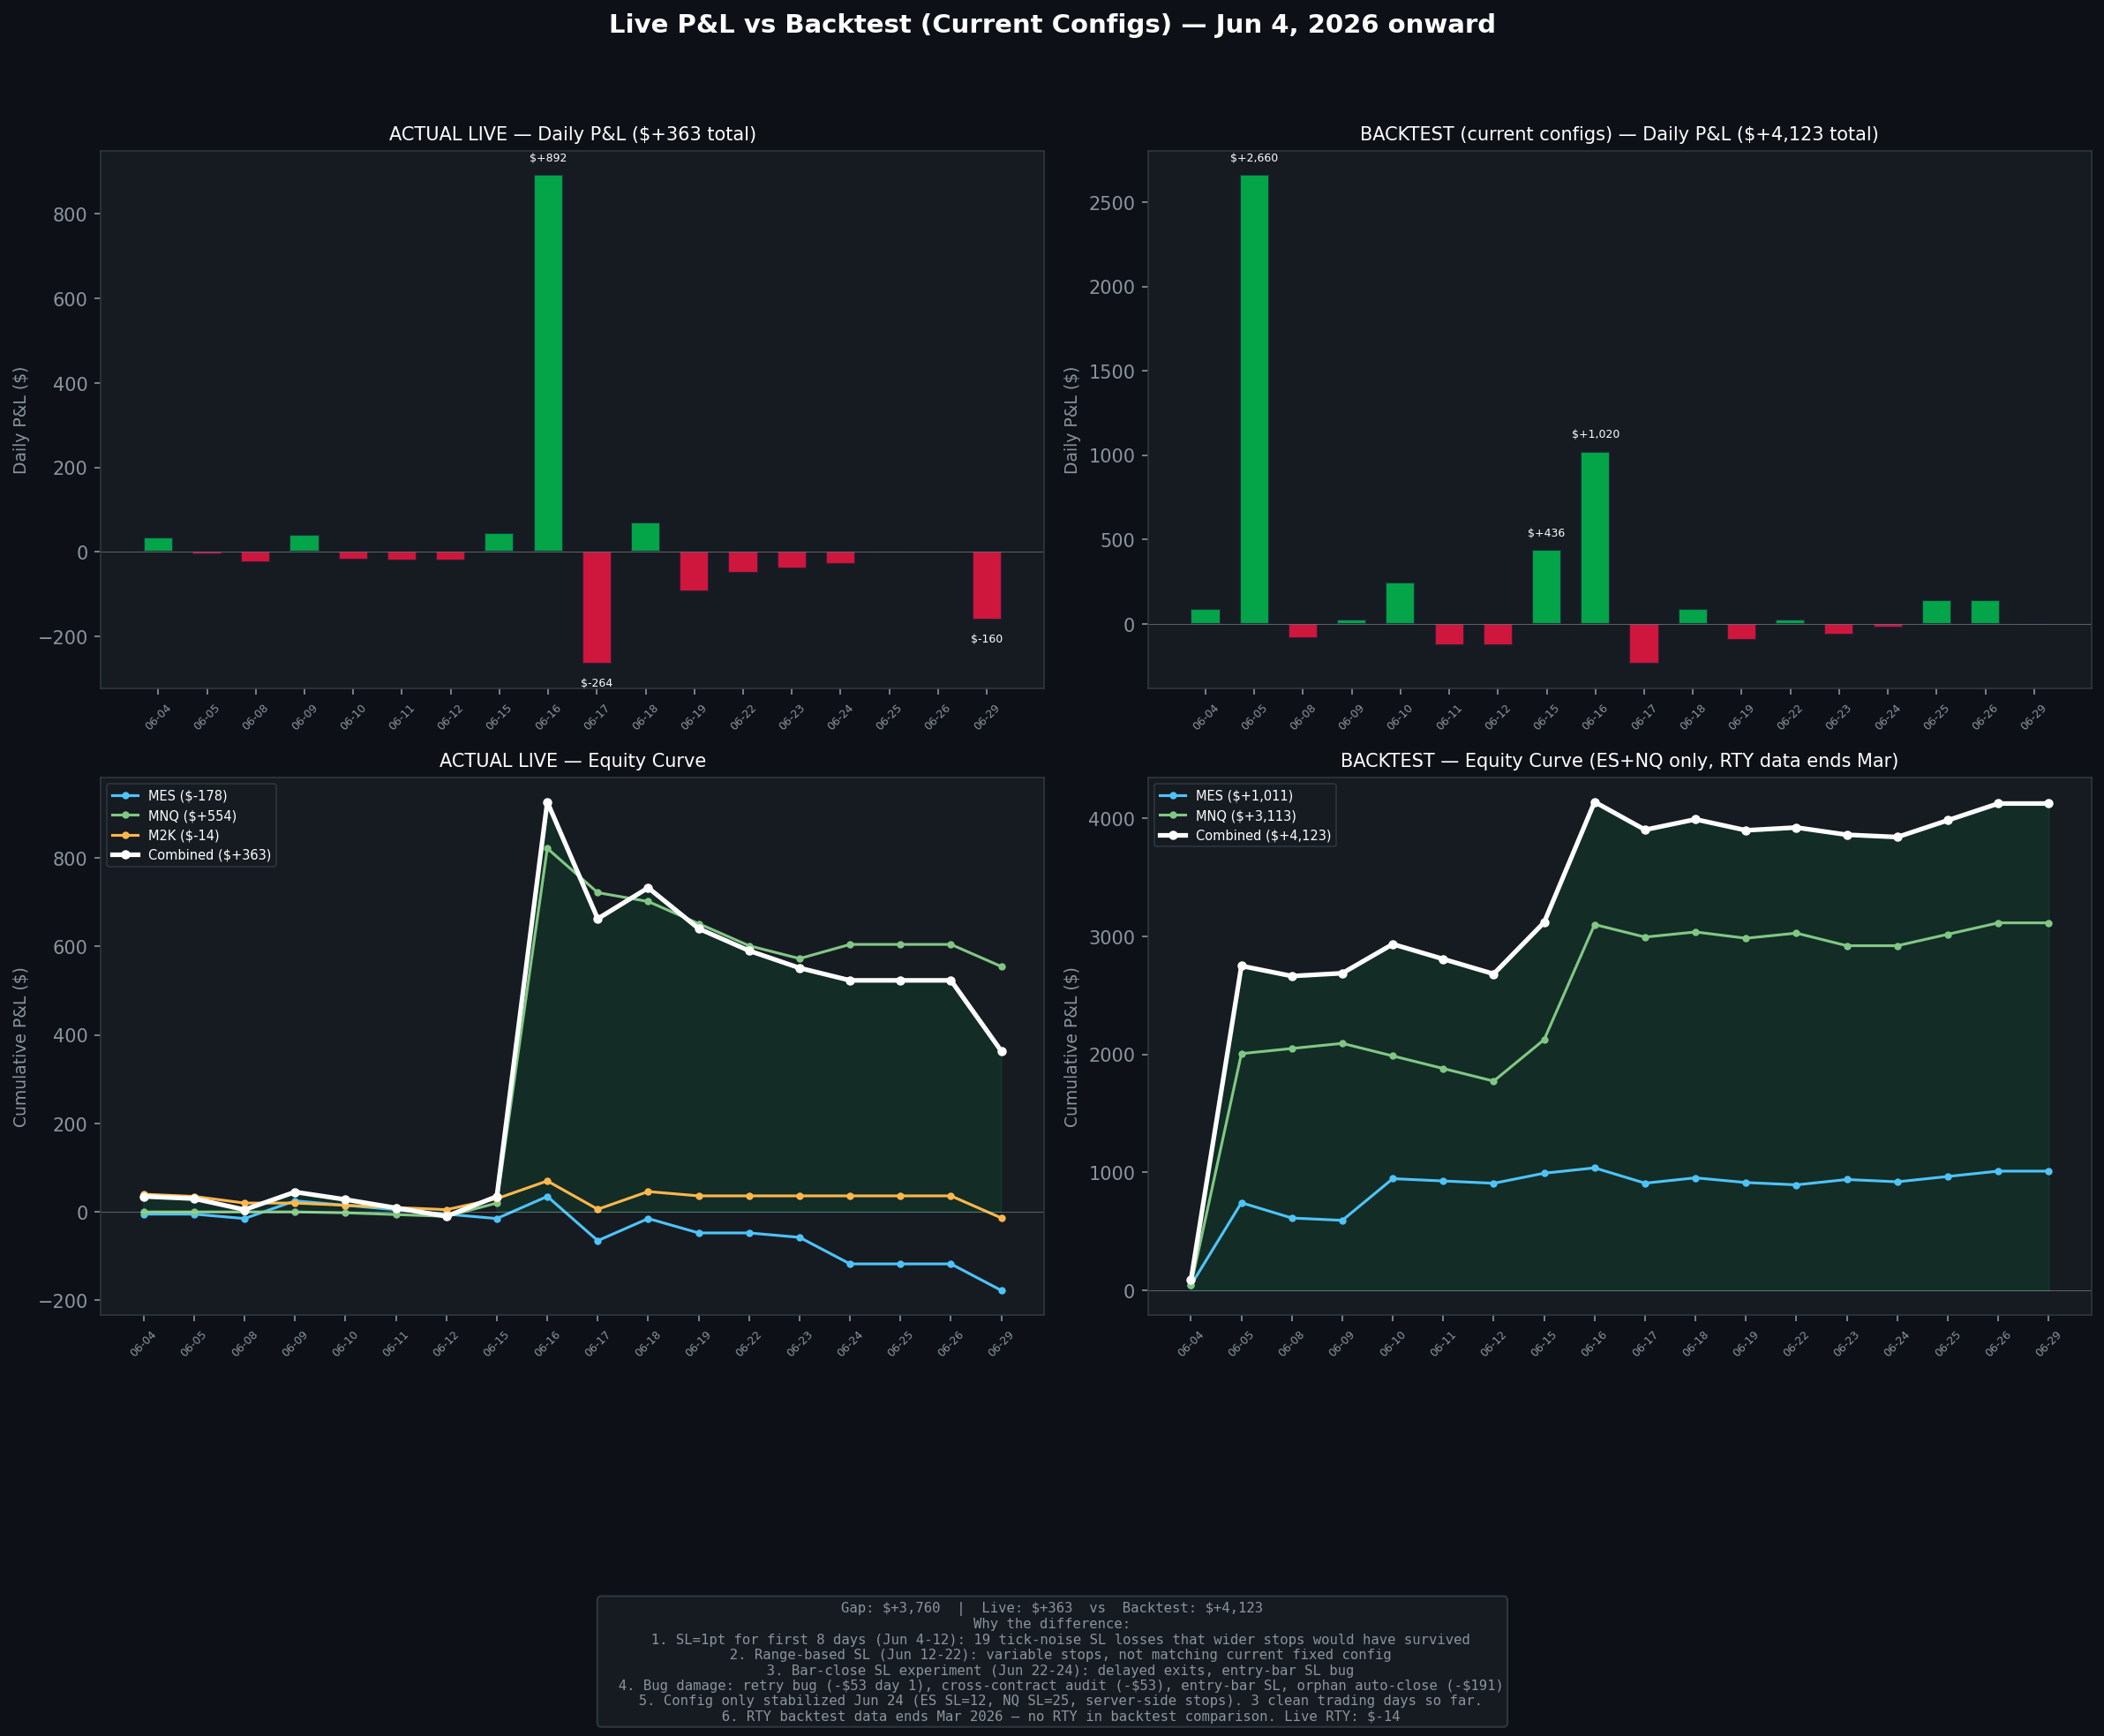
All three bots SL'd today. -$160 combined. After a month of live trading I figured it was time to look at this honestly.
Total live P&L since Jun 4: +$363 gross. The backtest says current configs should have made +$4,123 over the same period. That's a $3,760 gap. Looks terrible until you break it down.
The first two weeks I was running SL=1pt. That's 4 ticks on MES. Market noise. 19 trades got stopped out by normal intra-bar retracement that wider stops would have survived. Those 19 losses at $5 each are only $95 in direct damage, but the real cost is the winning trades they killed. Every SL hit replaced what the backtest shows as a TP win or a gap ride. That's where most of the gap lives.
Then there's the infrastructure. Day one the bot placed 10 accidental entries because a fill detection function returned None and the retry flag never got set. The cross-contract position audit closed the wrong instrument. An orphan auto-close feature killed a manual trade. The entry-bar SL check fired on the same bar as entry. Each one got fixed the day it happened, but the damage adds up.
Today the execution was actually clean. All three bots entered long, server-side SL stops placed on Tradovate, stops filled at the right price, exits logged with actual fill prices. The strategy lost because all three instruments broke out and reversed. That's a 4% day in the backtest distribution. About once a month.
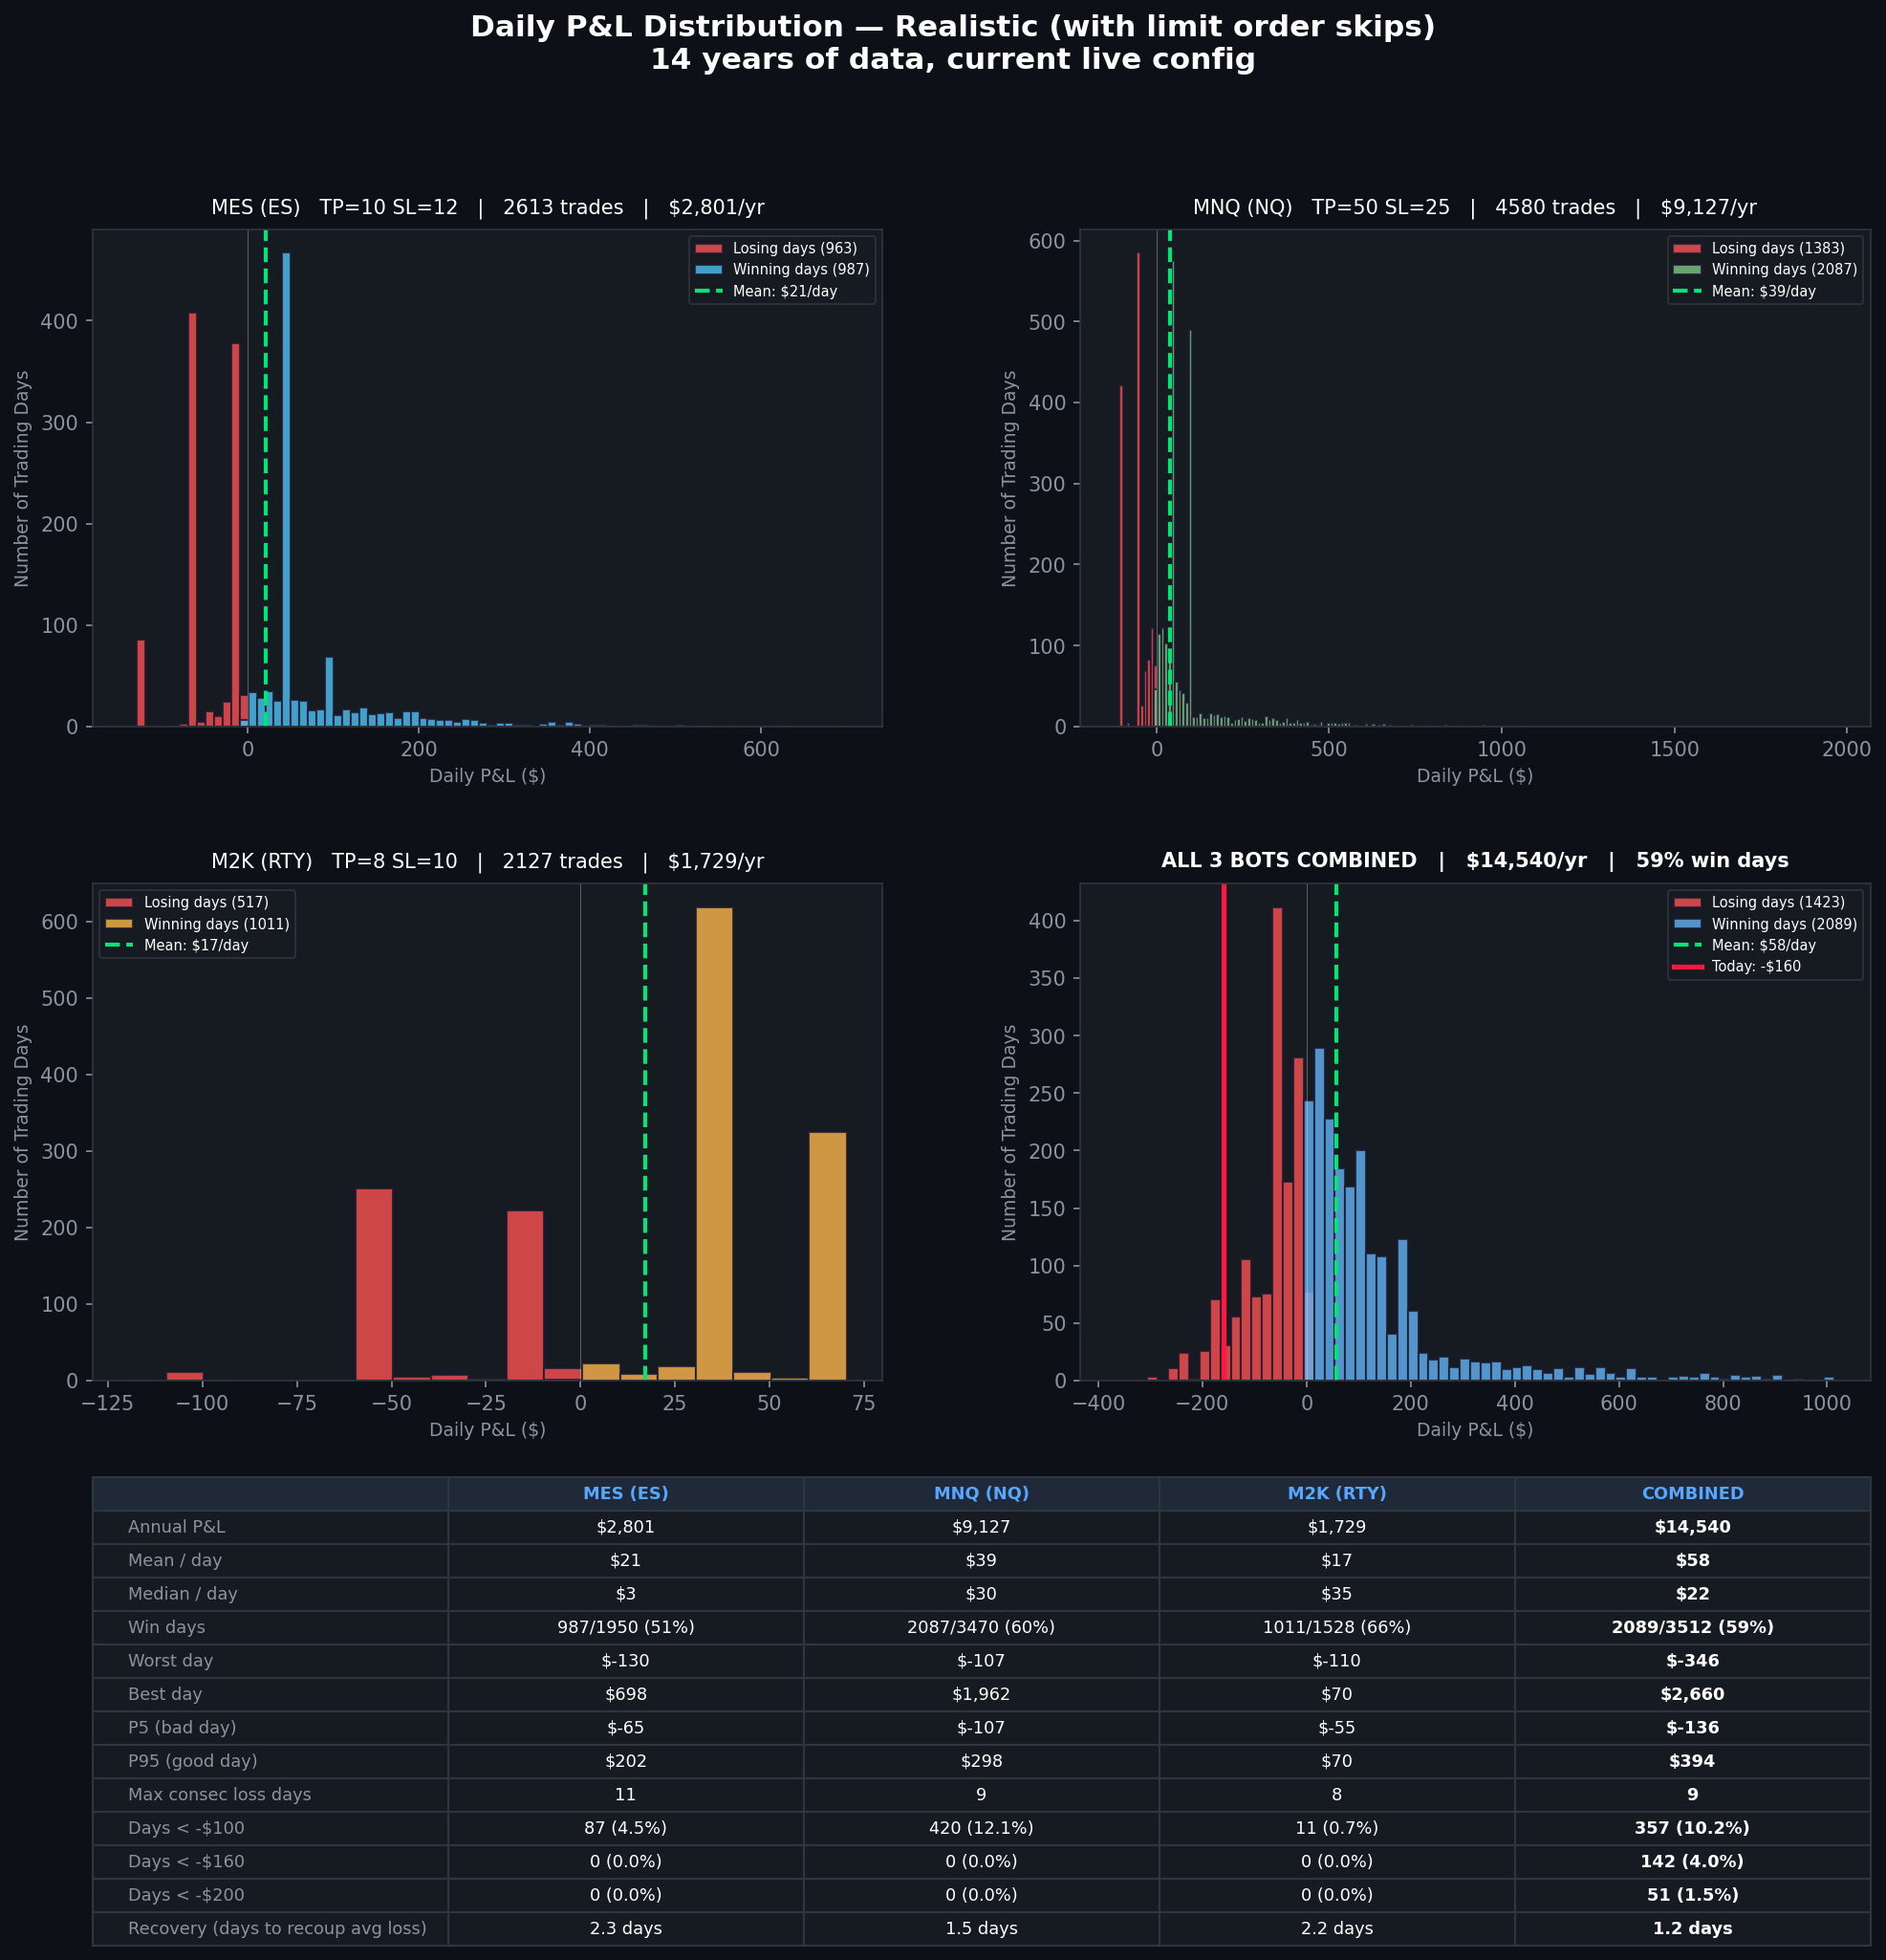
The distribution chart below is from 14 years of data with current configs and realistic limit order skips modeled in. Mean is +$58/day, 59% win days. Max drawdown is -$1,147 over 16 days, recovered in 47. My current drawdown from peak is about -$596, well within those bounds.
The config stabilized Jun 24. ES SL=12, NQ SL=25 (now TP=50), RTY SL=10, server-side stops, one-bar limit skip. The numbers from here forward are the ones that count.
Live P&L vs backtest (current configs) — the gap is from running wrong SL configs for the first two weeks
Daily P&L distribution — 14 years, current configs, with limit order skips. Today's -$160 marked in red.
Three days ago I switched from Tradovate's server-side stops to a bot-managed approach where I'd check each 5-minute bar's high/low against the stop level after the bar closed. The idea was that the backtest uses bar data, so checking stops the same way should match better.
Turns out I was wrong about what the backtest actually does. It checks bar_low <= stop_level for longs. That's the bar's extreme, the lowest tick during those 5 minutes. That IS what a server-side stop does. The backtest was already modeling server-side stops and I didn't realize it.
The only real difference is the fill. Backtest assumes you fill at exactly the stop price. Server-side stop fills at or near it. The bar-close approach just added a delay for no benefit.
Ran a full SL sweep with fixed stops and gap TP removal across 14 years. Sweet spots: ES SL=12 ($3,855/yr, Sharpe 3.41, 24/24 WF+), NQ SL=25 ($7,308/yr, Sharpe 3.96, 24/24 WF+). Combined ~$11,163/yr from two micros.
Wider stops hurt more per loss ($60 ES, $50 NQ instead of $10/$4) but win rate goes from 34% to 61% on ES and 33% to 62% on NQ. More importantly, the gap day runners survive. A 2pt stop kills a trade that dips 3 points before running 80. A 12pt stop lets it ride.
Back to server-side stops. Fixed, not range-based.
Turned RTY off. Juneteenth on June 19 was the last straw. CME closed early, the bot tried to send an EOD close, the exchange rejected it, and the position sat open all weekend with no stop. That on top of the day-one retry bug, exchange rate limits, orphan positions, and the time the ES bot accidentally closed an RTY position.
RTY was always the weakest in backtests too. 84% walk-forward positive vs 96% for ES and 100% for NQ. Cutting it simplifies everything.
Also changed how missed entries work. The bot used to cancel and re-place the limit order every new bar, sometimes waiting hours for price to come back. The backtest doesn't do that. In the backtest, if the bar closes past the boundary, you're in at the boundary price. One shot.
Now live matches: one bar, one chance. If the limit doesn't fill before the next bar closes, it cancels, marks the direction as skipped, and moves on. You get a Telegram notification so you know it happened.
This also killed a problem where a limit order would sit at the boundary while price was 50 points away. If price bounced back and filled it, that's a reversal entry, not a breakout. The backtest would never take that trade.
Three bots polling Tradovate every 0.5 seconds. 360 API calls per minute, 21,600 per hour. Tradovate's limit is 5,000. At 10:47 AM all three hit 429 Too Many Requests at once. Everything failed for 30 minutes. Stop checks, cancel requests, all of it. RTY ended up with 4 contracts because stale limit orders kept filling and the bot couldn't cancel them.
It got worse. The orphan auto-close feature detected a manually-entered NQ position and closed it. That was an intentional trade. The bot didn't know. -$191.
Three fixes, same day. Polling went from 0.5s to 5s. Entry orders switched from blocking (sit and wait) to non-blocking (place the order, check on it each poll cycle). And orphan auto-close got reverted to alert-only. The bot sends a Telegram message if it sees a position it doesn't recognize, but it doesn't touch it. I decide.
The whole thing was self-inflicted. Three bots hammering an API at subsecond intervals. Non-blocking entry alone cut API calls by 96%. With the slower polling on top of that, total usage dropped to about 1% of what it was.
First live test of yesterday's gap day TP removal. NQ gapped down 47 points overnight.
At 9:45 AM, a bar closed above the opening range high. The bot entered long, against the gap. Normal TP applied since it was opposite the gap direction. NQ hit the 15-point target in 23 seconds for $30.
At 10:20 AM, a bar closed below the opening range low. Short entry, with the gap this time. No take profit. Range-based stop at 30777.50. The position rode the trend all afternoon. At one point it was up 313 points ($626). By close: $778.50. That's 26x what the fixed TP would have captured.
Combined NQ: $808.50 on one day from both directions.
ES hit take profit at +10 points ($50). RTY hit at +8 points ($40). All three instruments, all three winners. The range-based stop deployed yesterday proved itself on ES. The trade dipped 4 points against before reversing to TP. The old 1-point stop would have killed it.
Combined ORB gross: $868.50 on the day.
Back from the long weekend. Turned the 1-DTE bot off.
The strategy works. 50 wins, 6 losses, backtest validated across 7.5 years. I'm not questioning any of that. But a max loss on a $5 wide spread is $500, and on this account that's 30-40% gone in one trade. Three gap losses hit in six weeks. The math says keep going, the account size says I can't afford to.
The ORB bots risk $50-60 per trade. Worst combined day in the backtest is -$346. That I can take. A $500 1-DTE loss on a $1,300 account, with Trump tweeting tariff policy at 2AM, is not something I want to hold overnight right now.
Plan is to bring it back around $10,000, where a max loss is under 5%. The record is 50-6 and the backtest is sitting there ready. Just need the account to grow into it.
Gap-up day. ES gapped +46 points, NQ +236, RTY +33. The 1-DTE call credit spread took a gap stop loss of -$230. Short strike was breached overnight and the gap stop fired correctly on the morning check.
On the ORB side, the past two weeks taught me something. Every accidental unprotected position (the day-one retry bug, the NQ stop rejection, the RTY exchange rate limit orphans) ended up profitable. Positions that survived without tight stops rode the full intraday move. Meanwhile, the protected trades with 1-point stops were getting knocked out on noise at a 9% win rate.
So: what if on gap days we remove the take profit in the direction of the gap and let the trade ride to EOD?
Backtested it. Removing TP on longs during gap-up days (and shorts during gap-down days) with a threshold of just 5 points nearly tripled the combined annual P&L for ES and NQ. ES went from $2,119/year to $5,092. NQ went from $2,907 to $13,294. Walk-forward validation: ES positive in 88% of out-of-sample windows, NQ in 100%.
RTY didn't validate. Only 69% of windows were positive, so it stays on fixed TP.
A gap tells you the overnight flow has a directional bias. If the market gapped up 46 points and then breaks above the opening range, taking 10 points of profit on that long is leaving the trend day on the table. Let it ride. The stop loss still protects the downside. The EOD close at 3:55 PM takes the profit at whatever level the trend reached.
Deployed for ES and NQ starting today. The portfolio status now shows gap direction and whether TP removal is active. The range-based stop loss from last week gives the trade room to breathe through normal retracements.
Two weeks of live data made the case. The ORB bots had a 9% win rate, 2 wins out of 23 trades. The backtest predicted 37-47%. The stop loss was the problem.
The backtest checks stop losses against 5-minute bar extremes: did the bar's low touch the stop level? In live trading, the stop is a real order sitting on Tradovate's servers. It fires on any tick, not just the bar's low. Any price at any millisecond within that bar. A 1-point stop on MES is 4 ticks. That's normal market fluctuation within a 5-minute bar. Price dips 1 point, the stop fires, price recovers and runs to the take profit. The backtest sees a winner. The live account sees a loser.
I widened the stop loss to match the opening range itself. Instead of a fixed 1-point stop, the stop is now placed at the opposite end of the ORB range. If you're long above the high, the stop sits at the low. Capped at 10 points for ES and RTY ($50 max risk) and 25 points for NQ ($50 max risk).
If price breaks above the opening range high and then falls all the way back through the range to the low, the breakout has failed. That's a real stop signal. A 1-point retracement within a 12-point range is just normal behavior during a healthy breakout.
The backtest at SL=2 (an intermediate step before the range-based approach) showed: ES win rate rising from 42.8% to 49.7%, NQ from 47.3% to 51.0%, RTY from 43.9% to 50.3%. Sharpe ratios dropped slightly because each loss is larger, but the higher win rate more than compensates in practice.
Limit order cushion was restored from 0.25 to 0.50 points. With the wider range-based stop, that doesn't meaningfully affect the stop protection and it improves fill rates.
Order placement was changed to one attempt per 5-minute bar instead of continuous 30-second cycles. The previous approach generated over 100 orders per hour when price was away from the boundary, triggering exchange rate limits on RTY. Per-bar ordering caps it at roughly 12 orders per hour.
Limit order timeout extended from 30 seconds to 4.5 minutes, giving the order nearly the full bar duration to fill.
Tradovate balance after two weeks: approximately $1,234, starting from $1,100. The account is up on paper but the gains are mostly from accidental unprotected positions, not clean strategy execution.
First week of live ORB trading done. Bots are working correctly. Got a set of parameter changes backed by walk-forward validation.
Day one and two exposed the gap between what the backtest assumes and what happens in real markets. The backtest enters at the ORB boundary price. The live bot was entering via market order, filling 2-5 points away from the boundary when price moved fast. With a 1-point stop loss, that difference changes the outcome entirely. A paper win becomes a live loss when entry is 5 points offside.
Switched from market orders to limit orders at the ORB boundary plus a 0.50-point cushion. If price has moved beyond that, the order doesn't fill and the trade is skipped. Some trades get missed, but the ones that execute now fill near the model's assumed entry price. The backtest says the strategy retains roughly 50-60% of its ideal P&L under degraded execution conditions (random slippage, missed entries, stop slippage). Still very profitable.
NQ hadn't traded once since going live. The opening range was exceeding 50 points every day, 93 to 172 points during the first week. A sweep of max_range from 50 to 200 showed no edge degradation over 14 years. NQ's wider intraday moves are structural. Max range raised to 200. NQ entered its first live trade on day four.
That first NQ trade exposed another issue. The stop-loss order was accepted by Tradovate but rejected by the exchange. The bot logged a $2 loss from the stop, but the position was actually still open with no protection. NQ rallied 86 points. I manually closed it for +$172. Fix: after placing a stop order, the bot now checks the order status one second later. If rejected, it flags the position as unprotected and handles exits internally.
The bigger discovery came from a parameter sweep. The original configs (TP=8 for ES/RTY, TP=10 for NQ) were sticky-note values from an earlier backtest using Schwab's $0.70 commission. Tradovate costs $2.28 per round trip. Running a full TP/SL grid with walk-forward validation at the real commission rate showed the optimal take-profit targets are higher.
NQ benefits the most. Its out-of-sample Sharpe ratio increases as TP widens, from 10.43 at TP=10 to 11.85 at TP=15 to 12.33 at TP=20. Unusual. It means NQ's intraday breakouts tend to run further than the target captures. At TP=15 with SL=1 and max range 200, NQ backtests at $3,317/year with 100% of walk-forward windows profitable.
ES improves moderately with TP=10 (up from TP=8): annual P&L rises from $2,125 to $2,407 with OOS Sharpe dropping only slightly from 5.83 to 5.58.
RTY does not benefit from higher targets. OOS Sharpe degrades from 4.98 at TP=8 to 3.08 at TP=20. RTY stays at TP=8.
New configs deployed: ES TP=10/SL=1, NQ TP=15/SL=1, RTY TP=8/SL=1. Combined projected annual from backtest: $7,386 (before execution degradation). At 50-60% retention under real conditions, roughly $3,700-$4,400/year from the three micro bots.
Tradovate account after week one: $1,252. Started at $1,100. The gain is mostly from the accidental NQ position, not clean strategy profits. The legitimate ORB trades were roughly breakeven after bug damage and commissions. Infrastructure is stable now. Parameters are validated.
The three ORB bots placed their first live trades today through Tradovate. RTY hit its profit target within 12 minutes for +$40. ES took a stop loss for -$5. NQ sat out because the opening range was 144 points, well above the 50-point max filter. Net on the legitimate trades: +$35 gross.
The first hour was chaos.
The Tradovate API turned out to be different from what the existing code assumed in almost every way that mattered. The original implementation used bracket order fields (bracket1, bracket2, stopProfit, stopLoss) that don't exist in Tradovate's actual PlaceOrder schema. The contract resolution used base symbols like "MES" when Tradovate requires the full front-month name like "MESM6". The fill price polling looked for an avgPx field in the order response that Tradovate doesn't return. Fill prices live in a completely separate /fill/list endpoint.
That last one caused the worst damage. The bot placed a market buy for RTY. The order filled immediately on Tradovate's servers. When the bot checked for the fill price, it got nothing back. It interpreted that as "order failed" and tried again. Ten times in fifty seconds, each one opening a new position. By the time I killed the bots and closed everything manually, the account was holding six M2K contracts. The emergency close cost about $53 between underwater fills and commissions on twenty round trips.
Two bugs compounding: the fill detection returned None instead of the actual price, and the bot didn't mark the trade as "taken" when the order was successfully placed. If the order got an ID back from Tradovate, it should have stopped trying regardless of whether the fill price was confirmed. Instead it kept retrying because traded_long was never set to True.
Every issue was fixable in a few lines. Contract names now auto-resolve to the front-month quarterly using expiration math. Fill prices come from /fill/list matched by orderId. The bracket order was replaced with a two-step approach: market entry, wait for fill, then place a separate stop-loss order with an explicit price. If an order is placed successfully (Tradovate returned an orderId), the bot marks it as traded immediately, even if fill detection has a problem.
The stop-loss order lives on Tradovate's server as a real resting order. If the bot crashes, the stop still protects the position. When the bot detects a profit target hit, it cancels the stop and places a market close. When the stop fills on its own, the bot detects it through price movement and logs the exit. EOD close cancels any remaining stop and flattens.
Starting Tradovate balance: $1,100. End of day: $1,063.70. The $36 loss includes the bug damage. Without it, the day would have been roughly +$20.
Found the root cause of the ORB underperformance. Took digging through 14 years of bar-by-bar data and comparing it line by line against the live bot logs, but once I saw it, it was obvious.
The backtest enters a trade when a completed 5-minute bar closes above the ORB high. The live bot was entering the moment any live price tick crossed the ORB boundary, checked every 5 seconds. Those are not the same thing.
In a trending market they produce similar results. Price breaks out, keeps going, the bar closes above the boundary, and both versions enter at roughly the same point. In a choppy market (which April and May 2026 have been), price spikes above the ORB high for a few seconds and then reverses back inside the range before the bar closes. The backtest skips that entirely. The live bot entered it, then got stopped out as price reversed. Every time. That's the whipsaw pattern I'd been watching for weeks without understanding the mechanical cause.
Quantified it across the full 14-year dataset. The bar-close model produces a 42.6% win rate and $34,422 net over 14 years. The bar-touch model (what the live bots were actually running) produces a 26.4% win rate and $12,490. The gap is $21,933 over 14 years, about $1,565 per year per contract. Entirely from this one implementation mismatch.
Fix is straightforward. After the ORB locks at 9:35, the bot now fetches the close price of each completed 5-minute bar from Schwab's history API before deciding whether to enter. It only enters when a bar closes above or below the ORB boundary. Entry price is set at the ORB boundary plus slippage, not wherever the live price happens to be when the bar is checked. Results cached per bar so there's one API call per 5-minute interval, not one every 5 seconds.
I also went back and corrected the paper trade history for all three bots. The old logs reflected the broken implementation. Using the corrected bar-close model and filling in the post-April data from Schwab's history API, the corrected results are: ES 40W/32L ($1,390 net), NQ 28W/25L ($473 net), RTY 14W/25L ($408 net). Combined $2,271 over the live paper trading period versus roughly $573 in the broken logs. A $1,698 gap entirely from the entry logic mismatch.
Bots have been running the corrected logic since this afternoon. First real test is tomorrow morning. I'm depositing into IBKR later this week and plan to go live with all three micros next Monday, assuming the paper results this week look right.
| Entry model | 14yr trades | Win rate | Net P&L | Annual |
|---|---|---|---|---|
| Bar close above ORB (backtest / fixed) | 3,168 | 42.6% | $34,422 | $2,459 |
| Any tick above ORB (old live bot) | 3,443 | 26.4% | $12,490 | $892 |
Put premiums had gotten small. VIX sitting in the 16-17 range, market was calm, credits on puts were a fraction of what they were in March and April when volatility was elevated. Strategy was still working (win rate fine, no losses) but the reward for the risk had shrunk.
The tariff situation that dominated March and April seems to be settling. The overnight gaps that were almost exclusively upward, the reason I switched to puts in the first place, haven't materialized the same way in recent weeks. Different environment than the one that justified the puts position.
I ran a full parameter sweep this morning: every combination of strategy (calls vs puts), delta (6 through 16), spread width ($5 through $25), profit target (50% vs 80%), and stop loss (none, 2x, 3x). Tested over the last two years of SPX data with walk-forward validation. 240 combinations.
Call credits have outperformed put credits by a wide margin over the last two years. Not just in total P&L, but in risk-adjusted terms. The best call credit setup (10-delta, $10 wide, 80% target, no stop) produced a Sharpe of 14.95 versus 4.0 for the equivalent put credit setup.
The puts were the right decision in March and April. Switching to them during a specific regime of upward gaps and tariff headline risk saved roughly $2,839 compared to staying on calls. But the two-year data makes clear that calls are the baseline. Puts were a temporary adjustment to an unusual regime.
I also bumped the delta from 8 to 10. The sweep showed 10-delta consistently outperforms 8-delta on calls across every width tested. Slightly more premium, marginally higher loss frequency, better overall Sharpe. Spread width stays at $5. The $10 wide numbers look better on paper but once you account for the 2x capital requirement, the risk-adjusted difference is minimal.
Current setup: call credit, 10-delta, $5 wide, 80% profit target, 3:30 PM entry. No stop loss. The sweep confirmed stops don't help on calls. They just reduce wins without cutting the rare large loss.
| Strategy | Delta | Width | Target | Stop | Sharpe (2yr) |
|---|---|---|---|---|---|
| Call credit | 10 | $10 | 80% | None | 14.95 |
| Call credit | 10 | $5 | 80% | None | 12.49 ← current |
| Call credit | 8 | $10 | 80% | None | 10.84 |
| Call credit | 8 | $5 | 80% | None | 9.13 |
| Put credit | 10 | $10 | 80% | None | 4.0 |
| Put credit | 10 | $5 | 80% | None | 3.61 |
| Put credit | 8 | $5 | 80% | None | 2.74 |
Between March 31 and April 14, 2026, I took three losses on the live 1-DTE strategy. The March 31 loss was a full max loss. SPX gapped up overnight straight through my short call strike before the market opened. After that I added the gap stop: a kill switch that fires on expiry morning if SPX opens more than 80 points past the short strike, closing early to limit damage.
It worked. April 8 and April 14 both triggered the gap stop and came in at -$385 and -$405, well below the ~$450 max loss each would have been without it.
But the gap stop limits losses, it doesn't prevent them. Three losses in six weeks, all from the same source: overnight upward gaps. Tariff deals announced over weekends. Trade war ceasefires. SPX opening 80-120 points higher every time, landing on or through my short call strike. I ran a replay of March and April using real SPX closes across every eligible day. Simulated calls came out at -$2,918. Simulated puts finished at -$79. My actual live account lost -$439, less because the gap stop caught two of the three. The dominant overnight risk was upward gaps and I was on the wrong side. Switched to puts. One line in the config file.
Then I looked at the account balance. Buying power requirement for one contract: $464. Account balance: $464. Technically tradeable. No buffer. One more max-loss event away from either missing entries or adding capital under pressure.
The $500 buffer rule came out of this. Never deploy capital that you can't afford to lose without it affecting the next trade. $464 BPR plus $500 sitting untouched means a full max-loss event leaves the system intact and able to continue. Below that threshold, the psychological cost of a loss starts bleeding into execution quality. The backtest assumes you always take the next trade. Real trading doesn't work that way when the cushion is gone.
| Scenario | Mar–Apr 2026 P&L | Notes |
|---|---|---|
| Call credit — simulation (every day, no gap stop) | −$2,918 | 22 trades, 6 losses |
| Call credit — live account (actual) | −$439 | Gap stop fired 2×, 2 sessions offline |
| Put credit — simulation (same period) | −$79 | Aligned with gap direction |
Friday afternoon, April 24. Gap stop was live. Strategy was switched to puts. The statistical case for entering was fine. I sat it out anyway.
The tariff news cycle had been making binary weekend announcements all month. Deals announced Sunday night, breakdowns announced Saturday morning, nothing predictable, all of it moving SPX by 100-150 points at the open. The gap stop limits damage from exactly these events. In theory, entering was fine. In practice, holding a position into a weekend where the primary risk driver was a single person's social media activity felt like a different kind of risk than the one the backtest modeled.
Some of that is fear, some of it is reasonable judgment about unquantifiable event risk. Probably both. The backtest doesn't have a category for "geopolitical uncertainty driven by an individual." It has historical gap frequencies. When the mechanism generating the gaps is new and the frequency is accelerating, historical frequencies understate current risk.
Came back May 1. Strategy entered, ran cleanly, no gap event. The pause didn't cost much.
The ORB bots got hurt badly the week of April 7th. ES took four consecutive stop-losses. RTY was no better. The tariff news cycle was creating intraday reversals so fast that both long and short breakout attempts were stopping out on the same day. One trade on April 9th got stopped out in five seconds.
I tested every filter I could think of: VWAP alignment, time caps at 30 and 60 minutes, skipping the first few bars after the open, gap size filters. Eight configurations total, tested across 14 years of data on three instruments, with walk-forward validation split into two independent halves.
None of them helped consistently. A filter that improved ES would hurt RTY. Something that worked in the first 7-year half failed in the second. The ORB strategy runs a 21% win rate by design because the reward-to-risk ratio is 8-to-1. Four consecutive losses sounds bad but it sits comfortably within the expected distribution. The 14-year backtest contains hundreds of weeks like that one.
The whipsaw losses weren't a signal that the system was broken. April 2026 was an unusually volatile, news-driven month, and the backtest already priced in months like that. Left the system alone.
March 31, 2026. SPX gapped up hard at the open, right through my short call strike. The position that had been a routine profit-target candidate the afternoon before was now a max loss. Nothing you do during market hours matters when the damage is already done before the open.
I had a strategy with a 99.1% backtest win rate. The losses are rare enough that you can study each one individually. So I pulled every loss from the 7.5-year backtest and looked for what they had in common.
They all had overnight gaps. Every one. Every losing trade in the dataset began with SPX opening significantly past where it closed the day before, jumping directly into or through my short strike before the market even opened. No amount of intraday monitoring could have saved those positions.
Gaps larger than 80 points occurred roughly 1.3 times per year historically. When they did, the spread had about a 50% chance of going to max loss. Expected cost of ignoring this: roughly $930 per event. I added a kill switch that fires only on expiry morning. If SPX opens more than 80 points past my short strike, the bot closes immediately.
The loss distribution is not random noise. Losses come from a specific, identifiable event type. That means the risk is manageable in a way that purely random losses wouldn't be. But event frequency can change with regime. Historically 1.3 per year. In spring 2026, several hit within weeks of each other. The strategy's edge was intact. What changed was how much buffer I needed to survive long enough to let it play out.
| Gap Size (overnight) | Frequency (historical) | Loss Rate | Expected Cost / Event |
|---|---|---|---|
| < 40 pts | Common | ~0% | — |
| 40–80 pts | ~3× / year | ~15% | ~$140 |
| > 80 pts | ~1.3× / year | ~50% | ~$930 |
Going through the strategy config looking for anything that was adding complexity without earning its place. The Kalman IV Z-score scanner had been in there since I built the first version. The idea was to only enter when implied volatility had spiked meaningfully above its recent baseline, capturing richer premium when the environment was favorable. I pulled the logs. It hadn't fired in 247 consecutive trading days.
The threshold required roughly a 4-5 point intraday VIX spike. Those are rare events, not normal trading days. In practice it was a gate that almost never opened.
I tested lower thresholds. Win rate dropped from 94.7% to between 50-80% depending on configuration. The scanner was selecting for high-IV moments, but high-IV moments during the trading day often mean the market is moving fast. A fast-moving market is exactly when short options carry the most risk. I was inadvertently filtering toward the most dangerous entry conditions.
Removed it. The unconditional 3:30 PM entry matched or beat every gated version. Same decision applied to the afternoon entry window itself: the data from a 25,000-trade study showed afternoon entries (1 PM and later) outperform morning entries significantly. I enter at 3:30 PM and hold to expiration the next day. No gates, no conditions, no scanner.
A feature that adds complexity without adding edge is a liability. It can break, it can drift out of calibration, it's a decision point where you can second-guess yourself.
It started with reading.
I went through everything I could find with real numbers behind it. AQR's research on the Volatility Risk Premium documented across every major equity index from 1996 to 2016. CBOE's published data on SPX options market structure and 0-DTE/1-DTE usage. SSRN academic papers on short-dated options pricing and variance risk premium. ERN's 10+ year live track record selling SPX puts daily. Spintwig's published backtests across hundreds of strategy configurations. Zarattini, Aziz, and Barbon's 2024 paper on intraday momentum breakouts and what actually makes ORB strategies work. I wasn't looking for tips. I was looking for documented edges, strategies where someone had done the rigorous work and shown a structural reason the opportunity should persist.
The VRP kept coming up across every serious source: implied volatility consistently runs above realized volatility, and the sellers of that gap have earned a Sharpe of roughly 0.6 across two decades of data. That's a structural feature of how markets price fear. I gathered a wide list of candidates (options premium strategies, opening range breakouts, mean reversion setups) and started filtering for what was actually reachable with a small account.
Most institutional approaches aren't reachable. You need capital scale, infrastructure, or instruments retail traders can't access. First filter: what can I run with a few hundred dollars and still model honestly? Second filter: what has a structural reason to work, not just a historical pattern that might be noise?
Then I started testing. I have a physics background. My default mode is to build a model, test it against data, and let the results tell me what to think. I threw ideas at backtests: different instruments, different entry rules, different exit conditions. Parameter sweeps on the most promising setups. Walk-forward validation to check for overfitting. Monte Carlo to stress-test the distribution of outcomes. The goal was to find the setup where the edge was real, robust, and survived out-of-sample.
The pipeline for each strategy is the same. Read the research. Build the model. Run the backtests and sweeps. Validate with walk-forward and Monte Carlo. Build a paper bot. Run it on real market data with realistic fills. If the paper results hold up, deploy real capital.
The 1-DTE SPX credit spread was the first strategy to graduate that pipeline. 7.5 years of data, 98.5% win rate, Sharpe 9.13, max drawdown $759. The paper results held. I put cash in. The ORB futures bots, built on the Zarattini breakout framework and optimized against 14 years of ES, NQ, and RTY data, are in the paper phase right now. They go live when the results are clean for a few consecutive weeks.
The journal entries that follow are about what happened when things broke, what I did about it, and what I learned.
| Metric | Value |
|---|---|
| Strategy | SPX 1-DTE call credit spread, 10-delta, $5 wide |
| Backtest period | 7.5 years of SPX data |
| Win rate | 98.5% |
| Sharpe ratio | 9.13 |
| Avg P&L / trade | $23.63 |
| Annual (estimated, 1ct) | ~$5,680 |
| Max drawdown | $759 |
| Buying power required | $464 / contract |